READ TIME - 6 minutes ⏳
In many teams, the moment someone says “we need visibility,” a dashboard starts getting built.
No kickoff. No spec. No discussion of who it’s for or how it will be used. Just a blank Power BI canvas and a vague expectation of “insights.”
But this reflex (treating dashboards and reports as the end of a process) would never pass in product or design work. Imagine shipping an interface without knowing who it’s for. Or publishing a screen without context, workflow, or purpose.
That’s what BI solutions quietly inherit when they're treated as visual output, not product input.
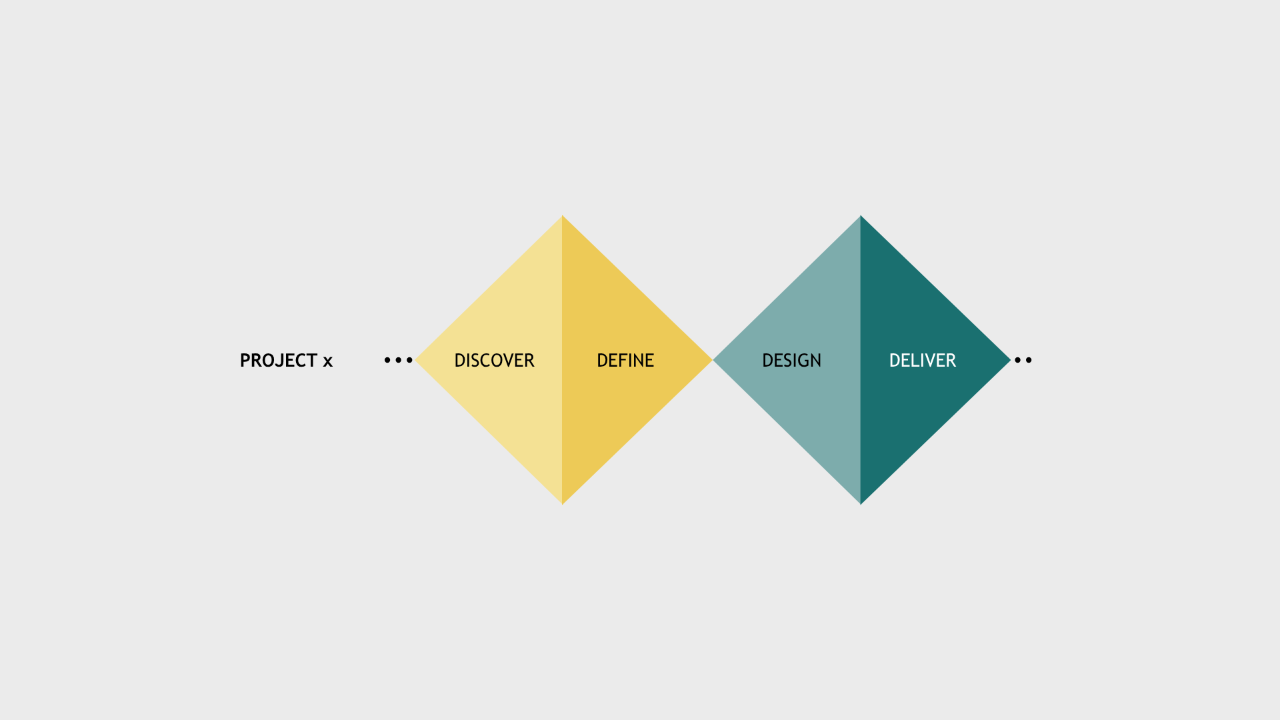
Design is planned. Dataviz is often rushed.
In design, we expect friction upfront.
User journeys are mapped. Personas debated. Success states defined. There’s language for ambiguity, and process to navigate it.
Data teams rarely get the same affordance.
The brief is often a request: "can you make a dashboard that shows X?"
The output is often a guess.
What’s missing is the middle: where framing lives.
Where the why of the thing earns as much attention as the what.
Most BI solutions aren't broken. They're misaligned.
They look clean. They work technically. But they don’t fit.
Fit the person. Fit the moment. Fit the decisions that matter.
That misalignment is rarely visible at delivery. It becomes clear later, when usage drops, questions resurface, or trust quietly erodes.
And by then, we’re usually optimizing the wrong part: tweaking visuals, not reconsidering purpose.
Design systems know this already

A good design system isn’t just about consistency. It’s about clarity.
Every component exists for a reason. Each has a job, a state, and a context.
No one throws buttons on a screen because they’re available.
Yet that’s how many Power BI reports get made: by assembling reusable parts (charts, filters, cards) without a clear narrative or interaction model.
Design systems work because they’re built on decision systems, and dataviz solutions need the same architecture.
Data products need product thinking
If we agree that dashboards and reports are interfaces, then they deserve the same care.
They need:
-
A defined audience
-
A primary action or intent
-
A place in a larger journey
-
A signal for success or failure
They should not outlive their purpose. They should not replace operational tools. They should not serve three user types at once in the same screen.
That’s not efficiency. That’s confusion.
Quick fixes & shortcuts lead to long-term mess
What starts as a prototype becomes a dependency.
What starts as a dashboard becomes an application.
And what started as insight delivery now powers daily operations.
Data teams end up managing UX debt they never signed up for:
-
Tools being used for things they weren’t designed for
-
Pages becoming decision hubs without ownership
-
Models growing massive to keep everyone satisfied
This isn’t bad intent. It’s lack of lifecycle.
What design teams already solved

Design teams learned to sunset features. To run audits. To say no.
They use systems not to make things faster, but to make things intentional. To avoid clutter. To clarify purpose.
Data teams can do the same.
Imagine reports that enter a lifecycle:
-
Validated for usage at 3 and 6 months
-
Archived when the problem evolves
-
Escalated when they become operational
Just like a feature. Just like a product.
Treat reports like products, not slides
The homepage of your dashboard is not decoration. It’s orientation.
Each page is a landing page. It should guide action, not explain content.
Navigation is not an extra, it’s how users know where to go.
Design systems taught us that friction isn’t the enemy, but confusion is.
Dataviz solutions, like good products, need affordance, feedback, structure.
They need to be part of something larger. Not just visually, but strategically.
One simple test
If you shipped a dashboard this month, block 30 minutes on your calendar for end of Q1.
Ask:
-
What did we assume when we built this?
-
What did we expect people to do with it?
-
Did that actually happen?
If you can’t answer those questions, the problem likely started earlier.